LYNN BERGMAN: TAXATION HISTORY, CATEGORIES AND COMPARISONS - PART III
Part III - Relative Merits of Various Taxes
A. Competitiveness with other states:
The Tax Foundation’s 2013 State Business Tax Climate Index is a hierarchical structure built from five components:
• Individual Income Tax
• Sales Tax
• Corporate Income Tax
• Property Tax
• Unemployment Insurance Tax
Each of the five components is weighted based on the variability of the fifty states’ scores from the mean. The standard deviation of each component is calculated and a weight for each component is created from that measure. The result is a heavier weighting of those components with greater variability. The weighting of each of the five major components is:
33.1% — Individual Income Tax
21.5% — Sales Tax
20.1% — Corporate Tax
14.0% — Property Tax
11.4% — Unemployment Insurance Tax
The individual income tax, with the greatest variability among the states, is the tax that, in theory, offers a state’s businesses the opportunity to achieve the most competitive edge as compared to neighboring states. On a dollar for dollar basis, a reduction of the unemployment insurance tax would offer businesses about one third the positive impact as compared to an equal amount of reduction in the individual income tax.
For simplification to a scale from one to ten, these weightings are multiplied by 0.3 and represented as “Potential Competitive Impact” as shown below:
Potential Competitive Impact of Reduction
9.93 — Individual Income Tax
6.45 — Sales Tax
6.03 — Corporate Tax
4.20 — Property Tax
3.42 — Unemployment Insurance Tax
B. Taxes Necessities:
The website report, “100 years of U.S. Consumer Spending”, 2006 is referenced and can be found at: http://www.bls.gov/opub/uscs/report991.pdf
While the report is almost 8 years old, it is the most recent available. What is important to this paper is that while the amounts have increased, their relationship to each other is not believed to have changed significantly enough to be of concern.
Results:
The average family in the United States (2.5 persons) with gross annual income of $50,302 spends $40,748 of its “take home” income of $47,787. About 50% ($20,410) of spending is on the basic necessities, 13.1% ($5,357) for food, 4.1% ($1,694) for clothing, and 32.8% ($13,359) for shelter. The average family owns two cars, spending about 19.1% ($7,770) on transportation*. The same family spends about 5.9% ($2,384) on healthcare*, with 3% ($1,210) of the 5.9% going for health insurance premiums. Family spending on personal insurance and pensions* is 9.8% ($3,978). So food, clothing, shelter, transportation, healthcare, and insurance/pensions account for about 85% ($34,542) of family expenditures totaling $40,748.
*For the purposes of this paper, we shall consider transportation, healthcare (including health insurance), and insurance/pensions (life, auto, etc./401K, IRA, etc.), representing three additional elements of individual and family responsibility, to be necessities. Expenditures NOT considered necessities include those for alcohol, entertainment, personal care products and services, reading & education, tobacco, and cash contributions.
For the average family in the United States, the relative maximum amount subject to the various taxation venues (rounded to nearest $10) follows:
Individual Income Tax $50,300
Sales Tax $14,820 (food, clothing, transportation)
Corporate Tax* $7,130
Property Tax $13,360
Unemployment Insurance Tax $0
*Since the corporate income tax is ultimately paid by the consumer, and since corporate income taxes amount to about 2% of GDP, we multiply the 2% times the average family’s after-tax income of $47,787 yielding the amount of $955.74 passed through to the average family. The effective corporate tax rate in years 2000-2005** was 13.4%, so the amount subject to the tax is $7,132.
**http://en.wikipedia.org/wiki/File:Effective_Corporate_Tax_Rate_OECD_Countries,_2000-2005_Average.jpg
http://economix.blogs.nytimes.com/2013/10/29/a-new-view-of-the-corporate-income-tax-2/?_r=0
Taxes Necessities (incl. transportation, healthcare and insurance/pensions)
10.0 — Individual Income Tax
2.94 — Sales Tax
2.66 — Property Tax
1.42 — Corporate Tax
0.00 — Unemployment Insurance Tax
C. Assessed Non-uniformly:
F. A. Hayek in his masterpiece “The Law” explained that the two essential elements of the “rule of law” are that a proposed law be permanent and that it not favor one individual or group over another. We must, therefore, assign the relative degree of non-uniform assessment of the five taxes under consideration.
Few would disagree that the least uniformly assessed tax is the property tax, with its exemptions for new homes, renaissance zones, relocated businesses, and seemingly any other scheme that a majority group of politicians on a local government board or commission may wish to employ to reward their “friends” in business… and especially in the areas of real estate, homebuilding and land development. Another serious problem with the property tax is the inherent variance of residential and commercial assessments from locations to location. We will assign the property tax a value of 10.0 for non-uniformity.
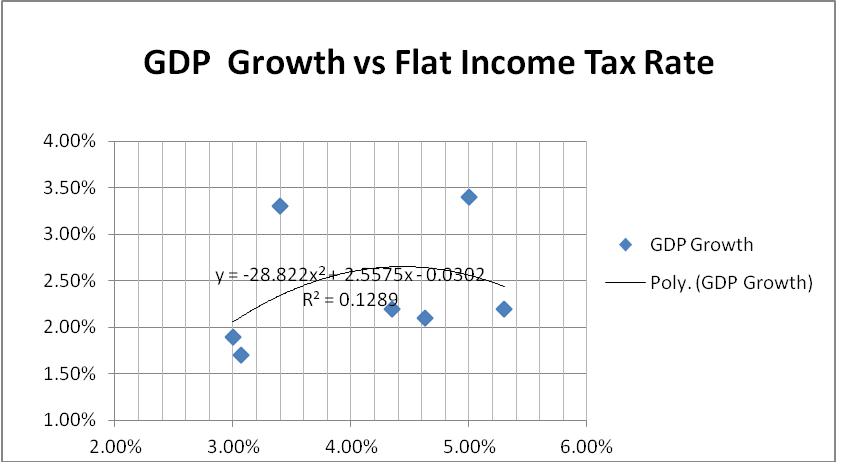
Seven states have a flat rate individual income tax, as determined from the websites indicated below:
http://taxes.about.com/od/statetaxes/a/States-with-flat-tax-rates.htm
http://bea.gov/newsreleases/regional/gdp_state/gsp_newsrelease.htm

Analysis of the data for the seven states offers a preliminary indication that GDP Growth is optimized at 4.5% income tax rate. Correlation of the second order polynomial is 13.12%. As additional states adopt a flat income tax rate, the correlation should improve. It is promising, however, that this example of a Laffer curve arose from the minimum data available. The horizontal axis represents the Flat Income Tax Rate and the vertical axis represents GDP Growth. We will assign the income tax a value of 8.5 for non-uniformity because only about 15% of the states have adopted a flat individual income tax.
A similar analysis of the 45 states that levy sales tax indicated the same optimum rate of 4.5%, after removing the data for “outlier” North Dakota (5% sales tax and 13.4% GDP Growth) which had skewed results by +0.2% to 4.7%.
The Sales Tax, a consumption tax, would be completely “fair” if pre-bates or re-bates were distributed to the poverty stricken. It is generally applied at the same percentage for all consumers but 35 of the 50 states levy a sales tax in excess of the arguably optimum rate of 4.5%. The number of exemptions for various commodities, such as food or clothing, varies state to state. We will assign the sales tax a value of 2.5 for non-uniformity
The corporate tax is so complicated and disparate from state to state that we will assign it a value of 5.0 for non-uniformity. It should be viewed as an extremely complicated extension of the sales tax because it is simply passed through to consumers.
Taxes Assessed Non-uniformly
10.0 — Property Tax
7.50 — Income Tax
5.00 — Corporate Tax
2.50 — Sales Tax
0.00 — Unemployment Insurance Tax
D. Summary
Averaging the scores of assessment categories A, B, and C, we arrive at the following:
9.14— Income Tax
5.62 — Property Tax
4.15— Corporate Tax
3.96 — Sales Tax
1.14 — Unemployment Insurance Tax
E. Commentary
Federal Taxes
The obviously worst tax devised by mankind is the federal progressive individual income tax. Its reform could insure that no worker would ever again wonder why they had worked so hard to get a raise… only to find out that their take home income went DOWN because of entry into a higher tax bracket.
The 100 year old (16th Amendment to the Constitution) federal income tax rose to a maximum rate of 77% on incomes over $1 Million ($18 Million in 2013 dollars) during WWI and 94% on incomes over $200,000 ($3.6 Million in 2013 dollars) during WWII. Today the maximum rate is 39.6% on incomes over $400,000 for Single taxpayers, $450,000 for Married, and $425,000 for Head of Household.
Author C.S. Forester’s 1958 novel “Admiral Hornblower in the West Indies” takes place in the period May 1821-October 1823, a time of peace for Britain. Fictional Royal Navy officer Horatio Hornblower recalls the comment of the First Sea Lord while conducting the interview in which Hornblower was offered appointment as commander-in-chief of His Majesty’s ships and vessels in the West Indies, “The House of Commons would sooner allow the Royal Navy to rot at its moorings than re-impose the income tax.” Our founders’ belief that the income tax was a necessary evil only in times of war was obviously in accordance with the views of the citizens of Britain during the same time frame.
The Heritage Foundation favors replacement of the current IRS tax code with a “flat” tax of about 28% (less than the current 30.3% to 35.3% paid by working families) applied to wages, salaries, and benefits after subtraction of tax-deferred savings. Only three deductions (charitable contributions, higher education expenses, and home mortgage interest) and two credits (one for health insurance costs and one extending the earned income tax credit for low-wage workers) would be allowed. Corporate taxes would be replaced (after a seven year “transition” from the current 35% rate by lowering 1% per year) at the same 28% rate to be applied to the sales of domestic goods and services with deductions for labor and business costs, including the expensing of capital purchases. For more details, visit the following site:
http://www.heritage.org/research/reports/2011/12/the-new-flat-tax-easy-as-one-two-three#_ftn1
State Taxes
Seven states, Alaska, Florida, Nevada, South Dakota, Texas, Washington, and Wyoming have no individual income tax. South Dakota shares 360.57 miles of border with North Dakota. The United States has signed income tax treaties with over 65 countries toward eliminating “double taxation”. Applying a state income tax IN ADDITION to the federal income tax is, in essence, the same “double taxation” that foreign countries are protected against by treaties with the United States.
Property tax is unacceptable primarily because it is collected under threat of loss of one’s property. A replacement tax EQUALLY levied to each resident for only the specified role of local government and without the coercion of property confiscation would be far more tolerable. It is time to find an equitable and non-coercive method of funding local government. Property tax MIGHT be have been accepted by its victims… IF local elected officials had limited budget increases to the rate of inflation, AND only spent the revenues on police, fire, health and safety, and utilities maintenance (water, sewer, and roadways), the legitimate roles of local government, AND had not created various schemes to exempt their “friends” from the tax.
Corporate tax is passed through to the consumer and is simply a complicated extension of the sales tax that pushes the amount of tax on sales above the optimum for growth of the economy.
Sales tax, a consumption tax, when applied by individual states at a rate of 4.5% or less, appears to be the fairest form of taxation. Limited government is best served by such a tax. A variation of the sales tax, the local option sales, is problematic because it is too often targeted to specific local industries such as farm machinery. The original framers of the law almost limited it to 1%, the prevalent rate imposed by cities, until large scale public outrage over property taxes. Since the defeat of Measure 2 to eliminate property taxes, local entities have raised local option sales tax rates in order to limit property tax increases.
Unemployment tax is also passed through to consumers. It is reasonable to suggest it be minimized by providing unemployment for a maximum four weeks; not 96 weeks of laziness & inactivity followed by the three weeks it takes 70% of recipients to find work.
James Madison stated, in Federalist No. 51, “In framing a government which is to be administered by men over men, the great difficulty lies in this: you must first enable the government to control the governed; and in the next place oblige it to control itself.”
Demographics of North Dakota and its Neighbors
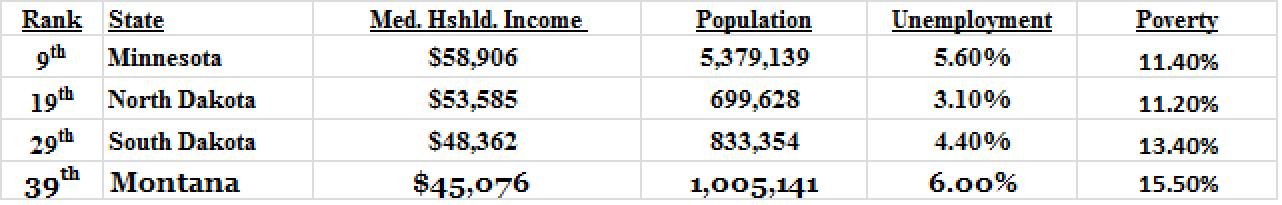
America’s Richest (and Poorest) States - 24/7 Wall St. http://247wallst.com/special-report/2013/09/19/americas-richest-and-poorest-states/#ixzz2jEIuENSP
F. North Dakota Major Revenue History
The $40+/Barrel price of oil of the early1980s began to slip in 1984, falling to $9/Barrel two years later when hundreds of oil workers moved out of communities like Williston and Dickinson.
The graph below visually illustrates the rampant growth of revenues from the oil production tax (implemented by the Legislative Session of 1953) and the oil extraction tax (implemented January 1, 1981 following the passage of Initiated Measure 6 in 1980. The gross value of oil production at the well is taxed at 5% in lieu of property taxes on oil and gas producing properties. Extraction is taxed at 6.5% of the gross value of oil production.
Equally eye-opening are the growth of combined state & local option sales tax revenues.
Individual and Corporate Income tax rates have recently been cut by elected officials… but not enough to seriously slow their revenue growth.
Property tax revenues are steadily increasing despite a slight dip in revenues beginning in 2009 when the state began to implement a “tax shell game” that richly compensates administrators within the K-12 education system while providing a minimum of “relief” to taxpayers. When I was in school in the late fifties and early sixties we had twice the students and half the administrators… yet I believe my education was as good or better.

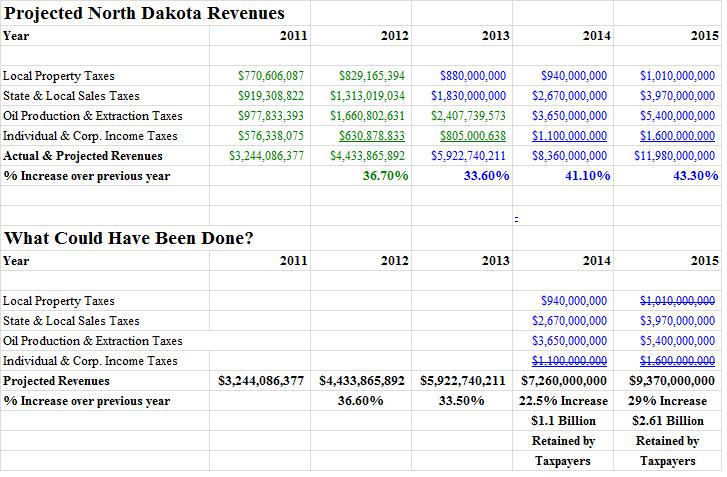
Are These Projections Legitimate?
While spending growth has ranged about 25% per biennium over the last several bienniums, revenue growth is approaching 80% to 100% per biennium (or 40% per year).
We are on target to collect about twice the income tax revenue in 2015 as was collected in 2013… and about two and a quarter times the oil tax revenue in 2015 as was collected in 2013. Let’s look at the first table above to see near term revenues. Then, in the second table, let’s see what could have been done by elected leaders to diversify our economy in the fairest of ways… to leave the hard earned money of taxpayers (who are also consumers) in their pockets and to relieve the income tax burden of businesses (who simply pass along income taxes to consumers in the form of higher prices). How competitive could North Dakota be if we offered our home-grown goods and services (in all areas, not just agriculture & oil) at prices well below neighboring states and often below the remainder of the world’s suppliers?
G. Recommendations for True Tax Reform:
First, North Dakota is not at war with anyone, although some would argue we are in a serious “battle” with the EPA. It’s time to eliminate the tax that our founders believed should only be assessed during wartime… the state income tax. In Year 2015, that would provide $1.6 Billion in “economic development” by leaving income in the pockets of those who earned it. True diversification of our North Dakota economy could finally begin in earnest. Remember that corporate income tax is really paid by consumers because it is added to the price of goods and services. Are we so greedy that we would deny lower prices to ourselves because some non-residents may benefit as well? As for our beloved farmers & ranchers, who are always telling me that they don’t pay significant income taxes…what about the rest of us that live in cities and don’t enjoy 125 years of century code favoritism?
Secondly, why would we hold home owners and business owners hostage to a tax that is unequally applied, increased annually to the level that valuation increases allow, and is increasingly employed to compete with private enterprise? Such a beast as the property tax must at least be reigned in and at best be eliminated. The use of the property tax should, at a minimum, be limited to the public services that benefit the property owner directly… police, fire, sewer & water service, public transportation, and their associated maintenance & administration. Civic center expansions, libraries, jails, recreational facilities, opera venues, and other “special interest” benefiting projects should be adequately planned (with ongoing collaboration between elected officials from city, county, and other boards) voted on and funded by other than the property tax. North Dakota would be foolish to pass on the elimination of a tax as egregious as the property tax when replacement funds are available and can be applied per capita to counties by a simple and fair method based upon historic (decennial census data) county population maximums. Replacing the property tax burden with such a formula that takes advantage of existing infrastructure would especially benefit small towns outside of the oil boom that need help with aging streets, water and sewer systems, and especially need updated but “least-cost” housing.
Thirdly, government should not be taxing food, clothing, shelter, or personal transportation… the essential elements of living. We don’t tax the consumption of food and Minnesota doesn’t tax the purchase of clothing. We also do not apply our sales tax to the purchase of a home or business. So why are sales taxes applied to used automobiles, used clothing, and other used thrift store items in North Dakota? That is double taxation of the same item and specifically targets the poorest among us!
Lastly, how many “legs” must a “stool” have before it becomes a “trough”? Our founders had a “one-legged stool”, the income tax that they applied only during war time. Why must we insist that all of the various deviant and unfairly applied forms of taxation be employed by government? Why not employ only the fairest of all, the sales tax and the taxes applied to our precious natural resources? The sales tax, a “consumption tax” that is proven to be optimized at 4.5% of the price of goods is as close to perfect as a tax can be. We have a state to diversify; let’s do it with our own money, not steal too much of it from someone else! The oil extraction tax should be reduced from 6.5% to 4.5% at a minimum to be competitive with other states now and in the future.
These two primary “consumption based” revenue sources, the sales tax and combined natural resource taxes (on coal, oil, gas, etc.), should be referred to as the “revenue ladder” that allows all working citizens to climb to the top applying the best of their abilities, work ethic, and courage, a welcome replacement of the multi-legged “trough”!
In my humble opinion, the operative word in the term “ three-legged stool” is “stool”.
H. Why not just maintain the status quo?
The alternative to true tax reform is to let the revenues continue to grow until the temptation to steal is too great for most to resist. To wait for the news channel to reveal the next suicide of a public servant that could not resist temptation nor explain “why” to friends and family. We’ve lost a few already; why keep stealing other people’s prosperity while feeding our own guilt? We can cut taxes… we can even eliminate a few!
Are we afraid to be competitive with our neighbors? Do we feel they will be offended? Just because we were on the same sports teams in college, must we resist outperforming other states in the free market? What we have uncovered in this document has been available to each and every North Dakota legislator and other elected officials. Why do they “sit on their bums and throw us crumbs” while “twiddling their thumbs over dismally small sums”? Do they think we’re that dumb? Chew some gum and contemplate some! THEN VOTE! It can make a difference.

 DakotaBeacon